

Introduction In a global financial system dominated by a few major currencies, liquidity challenges often arise during economic shocks or crises. To address such issues and enhance global financial resilience, the International Monetary Fund (IMF) introduced a unique international reserve asset known as Special Drawing Rights (SDRs). Though not a currency in itself, SDRs play a pivotal role in the international monetary system by supplementing the official reserves of member countries. What are Special Drawing Rights (SDRs)? Special Drawing Rights (SDRs) are international reserve assets created by the IMF to supplement the official foreign exchange reserves of its member countries. They were introduced in 1969, through the First Amendment of the IMF Articles of Agreement, primarily to address the limitations of gold and the US dollar in supporting global economic expansion and financial liquidity. Evolution and History The concept of Special Drawing Rights (SDRs) emerged during a time when the Bretton Woods system faced instability due to inadequacies in gold and U.S. dollar reserves. Year Milestone 1969 SDRs created due to inadequacy of gold and US dollar 1970-72 First allocation of SDRs (9.3 billion) 1979-81 Second allocation (12.1 billion) 1997 Proposal for a one-time special allocation (not implemented immediately) 2009 Third allocation during the global financial crisis (161.2 billion SDRs) 2021 Largest-ever general allocation of SDRs (456 billion SDRs) amid COVID-19 Composition of the SDR Basket The value of an SDR is based on a basket of five major international currencies. The composition is reviewed every five years. Currency Weight in SDR Basket (2022 Review) US Dollar (USD) 43.38% Euro (EUR) 29.31% Chinese Yuan (CNY) 12.28% Japanese Yen (JPY) 7.59% British Pound (GBP) 7.44% How Do SDRs Work? SDRs function as an international reserve asset that can be exchanged among IMF member countries for freely usable currencies (like USD, EUR, etc.). Here’s how they operate: Benefits of SDRs Benefit Explanation Enhances Liquidity Provides additional foreign exchange reserves during crises Global Financial Stability Reduces dependency on any single currency Low-Cost Reserve Asset No direct cost unless exchanged for hard currency Support for Low-Income Countries Can be used to bolster economic resilience in developing nations Non-Inflationary SDR allocations do not directly increase global money supply Limitations of SDRs Limitation Explanation Not a Currency Cannot be used directly for trade or transactions Limited Acceptance Only usable among IMF members and designated institutions Dependent on Willing Partners Exchange requires another country willing to accept SDRs Governance Issues SDR allocation depends on IMF governance and quota system Limited Role in National Economies Cannot replace monetary policies or domestic currency management 2021 SDR Allocation: A Case Study In August 2021, the IMF made a historic allocation of SDRs worth $650 billion to combat the economic fallout of COVID-19. How SDR Value Is Calculated ? The value of an SDR is determined daily by the IMF based on the market exchange rates of the SDR basket currencies. Formula: SDR Value = Sum of weighted values of the 5 currencies in the SDR basket(Updated every 5 years) Strategic Importance of SDRs in Global Financial Architecture Special Drawing Rights have increasingly become a geopolitical and economic tool beyond their original monetary purpose. 1. Crisis Mitigation Tool:SDRs act as a financial buffer during crises like: 2. Climate Finance via SDRs:Advanced economies are exploring ways to channel their excess SDRs into climate adaptation and green projects in developing countries via mechanisms like: 3. Global Economic Rebalancing:SDRs help bridge liquidity gaps in developing and low-income countries without adding to their external debt burden. Reforms and Suggestions Several reforms have been proposed to enhance the utility and equity of SDRs: SDRs vs Traditional Reserves Feature SDRs Foreign Exchange Reserves Nature Reserve asset Hard currency holdings (USD, EUR, etc.) Issuer IMF National central banks Usage Supplement reserves Direct international payments Interest-bearing Yes (SDRi) Varies Transferability Among IMF members Globally usable India’s SDR Position SDRs vs Central Bank Digital Currencies (CBDCs) Parameter SDRs CBDCs Nature Reserve asset issued by IMF Digital currency issued by central banks Usage Intergovernmental use General public & institutional use Convertibility Only among IMF members Freely convertible in domestic economies Goal Supplement reserves Modernize monetary systems Backing Basket of 5 currencies Backed by domestic legal tender Way Forward To make Special Drawing Rights more effective and inclusive, especially for low- and middle-income countries, several reforms and policy enhancements are essential: 1. Reforming IMF Quota System 2. Enhancing SDR Liquidity and Market Use 3. Using SDRs for Sustainable Development 4. Addressing Governance and Transparency 5. Digitalization and Technological Integration 6. Periodic and Contingent Allocations Conclusion Special Drawing Rights represent a critical tool in the global financial system, designed to supplement national reserves and promote international monetary cooperation. While they offer notable benefits during economic crises, their practical utility remains constrained by structural and governance limitations. With ongoing calls for reform, SDRs can evolve into a more powerful instrument for equitable global development and financial resilience—especially in a post-pandemic world. Frequently Asked Questions (FAQs) Q1. Is SDR a currency?No. SDR is not a currency but an international reserve asset. Q2. Who can use SDRs?IMF member countries and prescribed holders (e.g., BIS, ECB). Q3. Can SDRs be traded?Yes, but only among IMF members and designated institutions. Q4. What determines the SDR’s value?A weighted basket of five major international currencies. Q5. How does SDR benefit poor countries?It provides reserve support without increasing debt burden.
Anti-Defection Law in India
Introduction In a vibrant democracy like India, political stability is crucial for effective governance. However, rampant defections by elected representatives—popularly called “Aaya Ram, Gaya Ram” politics—led to frequent collapses of governments in the 1960s–1980s. To curb this menace and maintain political integrity, the Anti-Defection Law was introduced through the 52nd Constitutional Amendment Act of 1985. What is the Anti-Defection Law? The Anti-Defection Law is enshrined in the Tenth Schedule of the Indian Constitution, added by the 52nd Amendment Act, 1985. It lays down the grounds for disqualification of MPs and MLAs on the basis of defection to promote political stability and discourage opportunistic switching of parties. Background and Need for the Law Constitutional Provisions: The Tenth Schedule Provision Description Added by 52nd Constitutional Amendment Act, 1985 Part of Constitution Tenth Schedule Applies to Both Parliament (MPs) and State Legislatures (MLAs) Authority Speaker/Chairperson of the House Main objective Disqualify elected representatives for defection Grounds for Disqualification under the Anti-Defection Law A Member of Parliament or State Legislature can be disqualified: a. Voluntarily Giving Up Membership b. Voting/Abstaining Against Party Whip c. Independent Members Joining a Party d. Nominated Members Exceptions to the Law The Tenth Schedule initially allowed exemptions in case of splits and mergers, but changes have been made: Exception Details Mergers If 2/3rd of a legislative party merges with another party, the remaining members are not disqualified. Splits (Repealed in 2003) Earlier, 1/3rd of members forming a new group avoided disqualification, but this provision was removed by the 91st Amendment Act, 2003. Amendments to the Law 91st Constitutional Amendment Act, 2003: Role of the Speaker/Chairperson Landmark Judgments Case Verdict Kihoto Hollohan v. Zachillhu (1992) Upheld the law’s constitutional validity and allowed judicial review of the Speaker’s decision. Ravi S. Naik v. Union of India (1994) “Voluntarily giving up membership” can be inferred from conduct, not just written resignation. Manoj Narula v. Union of India (2014) Emphasized that constitutional morality should guide decisions. Speaker Arunachal Pradesh Assembly Case (2016) The Supreme Court can intervene in Speaker’s decisions when there is a constitutional violation. Criticisms of the Anti-Defection Law Criticism Explanation Curbs dissent Prevents MPs/MLAs from expressing independent views due to fear of disqualification. Encourages party dictatorship Excessive control of the party leadership over elected representatives. Misuse by Speakers Politically motivated decisions in favor of ruling party. Delay in decisions Disqualification cases often kept pending, weakening the law’s impact. Applies only in legislature Defections in public or internal party meetings escape scrutiny. Reforms Suggested by Committees Committee/Commission Recommendation Dinesh Goswami Committee (1990) Disqualification should be for only those voting against the party on no-confidence motions and money bills. Law Commission 170th Report Decision on disqualification should be made by President/Governor on EC’s advice, not the Speaker. Election Commission of India Wants power to decide disqualification cases instead of the Speaker. 2nd ARC (2007) Limit the law to confidence and no-confidence motions only. Importance of Anti-Defection Law in Indian Democracy Comparative Perspective: Anti-Defection Laws Across Countries Country Approach to Defection India Constitutional provision under Tenth Schedule. Strict disqualification for defection. UK No law against defection. Legislators can switch parties without losing their seat. USA No anti-defection laws; floor crossing is allowed freely. Bangladesh Article 70 of the Constitution disqualifies MPs for voting against party lines. Even stricter than India. South Africa Had a constitutional amendment to allow floor-crossing; repealed it in 2009 due to instability. Recent Controversies & High-Profile Cases 1. Karnataka MLAs’ Disqualification (2019) 2. Goa Assembly Defection (2019) 3. Maharashtra Political Crisis (2022–23) Reforms Proposed by Experts and Judiciary Reform Proposal Rationale Transfer decision-making from Speaker to independent tribunal or EC To ensure neutrality and quick decisions Limit whip application to only crucial votes To allow democratic debates Time-bound decisions by the Speaker To prevent deliberate delays Clearly define “voluntarily giving up” Reduce ambiguity Make defection a criminal offence in severe cases Act as a strong deterrent Conclusion While the Anti-Defection Law was enacted with the noble intention of curbing political opportunism, its implementation remains contentious. Though it has brought a degree of stability, the law has also raised concerns over curbing free speech of elected members and abuse by Speakers. Reforms are essential to strike a balance between stability and inner-party democracy, ensuring that elected representatives are accountable to both their party and the people. Frequently Asked Questions (FAQs) Q1. When was the Anti-Defection Law enacted? It was enacted in 1985 through the 52nd Constitutional Amendment. Q2. What is the main objective of the law? To prevent political defections and ensure governmental stability. Q3. Who decides on disqualification? The Speaker or Chairman of the respective House, subject to judicial review. Q4. What are the exceptions to the law? Only mergers involving at least 2/3rd of members of a party are exempted. Q5. Can a defector contest elections again? Yes, but they must resign and re-contest, unless disqualified under the law.
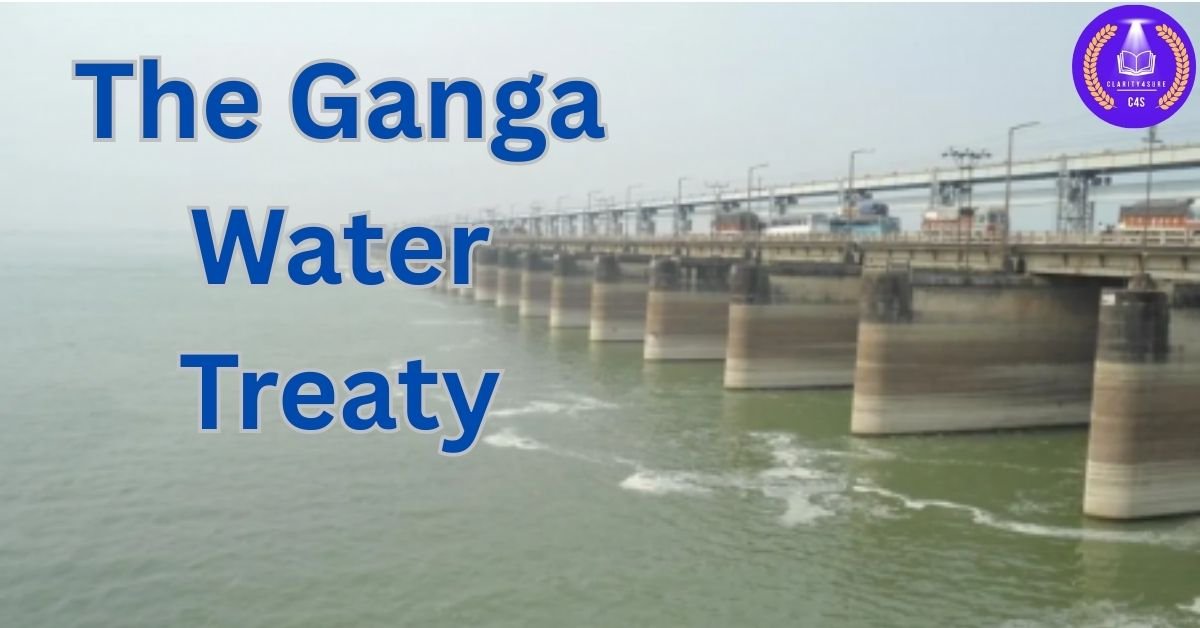
The Ganga Water Treaty
Introdution The Ganga, known as the lifeline of India, is one of the most sacred and vital rivers in South Asia. Its waters are essential not only for the spiritual significance they hold for millions of people but also for supporting the agricultural, industrial, and daily needs of the population. The Ganga flows through several states in India and is the primary source of water for more than 400 million people. The river is shared by both India and Bangladesh, which raises questions of its sustainable management and equitable distribution. Over the years, India and Bangladesh have faced numerous challenges concerning the utilization of the river’s water, particularly with the increasing pressure of population growth, climate change, and economic development. This led to the formation of the Ganga Water Treaty, a significant bilateral agreement aimed at resolving the water-sharing dispute between the two countries. Background of the Ganga Water Treaty The Ganga, which originates from the Himalayas in Uttarakhand, India, flows through India and eventually enters Bangladesh before merging with the Bay of Bengal. It covers a vast area, with its basin encompassing both countries. Historically, both India and Bangladesh relied heavily on the river for their agricultural, industrial, and domestic water needs, making the river an invaluable resource. However, over the years, the growing demand for water, coupled with environmental degradation, pollution, and changing climatic patterns, led to tensions between the two countries. The dispute over the water-sharing arrangements can be traced back to the early 20th century, but it gained significant international attention in the 1980s and 1990s. Both India and Bangladesh recognized the need to address this issue to prevent a full-scale conflict and ensure the equitable and sustainable use of the Ganga’s water resources. This led to the signing of the Ganga Water Treaty. Historical Evolution of Water Diplomacy Between India and Bangladesh India-Bangladesh Major River Treaties Treaty/Agreement River Involved Year Signed Duration Nature of Agreement Ganga Water Treaty Ganga 1996 30 years Binding treaty Teesta Agreement (Pending) Teesta Negotiation stage Not signed Proposed interim agreement Farakka Accord Ganga 1977 5 years Temporary sharing framework Key Provisions The Ganga Water Treaty, officially known as the “Treaty on the Sharing of Ganga Waters,” was signed between India and Bangladesh in 1996. The treaty was designed to resolve the water-sharing dispute over the Ganga River and promote cooperation between the two countries for the optimal and sustainable use of the river’s water. The primary objectives of the treaty are: Strategic Importance of the Treaty Ecological Impact and Environmental Concerns Despite its strategic success, the Ganga Water Treaty does not sufficiently address ecological sustainability. Issues include: These environmental impacts underscore the need to expand the treaty to include ecological flow requirements, ensuring the river remains healthy for both people and nature. Key Facts of the Ganga Water Treaty (1996) Feature Description Treaty Name Ganga Water Sharing Treaty Signed On December 12, 1996 Duration 30 years (Valid till 2026) Countries Involved India and Bangladesh Major River Ganga (Padma in Bangladesh) Lean Season Period January 1 to May 31 (most crucial for water sharing) Water Division Mechanism Based on a 10-day interval flow calculation using an agreed formula Monitoring Mechanism Joint Committee (India-Bangladesh) formed to oversee implementation Challenges and Issues Post-Treaty Although the Ganga Water Treaty laid down the foundation for cooperative management of the river, it has not been without challenges. Some of the primary issues and concerns include: Recent Developments and the Future of the Treaty Despite the challenges, both India and Bangladesh have made efforts to address the concerns arising from the treaty. Recent developments indicate a growing commitment to cooperative water management. The Joint River Commission has continued its work to monitor the Ganga’s flow and resolve disputes, and both countries have expressed their willingness to enhance bilateral cooperation for water-sharing. In 2018, during the visit of Bangladesh Prime Minister Sheikh Hasina to India, both nations agreed to further strengthen their cooperation on water management. This includes increased collaboration on flood management, sharing of hydrological data, and the construction of new infrastructure projects that benefit both countries. Moreover, India has taken significant steps to clean and rejuvenate the Ganga through the Namami Gange Programme, launched in 2014. While the program primarily focuses on cleaning the river and preserving its ecosystem, it also complements the provisions of the treaty by ensuring that the Ganga’s water remains clean and accessible for both India and Bangladesh. Conclusion The Ganga Water Treaty remains a crucial document for managing one of the most vital transboundary rivers in the world. While it has successfully addressed several challenges in water sharing, the evolving dynamics of population growth, climate change, and pollution present new hurdles. The treaty’s success depends not only on the commitment of both India and Bangladesh but also on their ability to adapt to changing circumstances. The future of the Ganga, and the millions of people who depend on it, hinges on continued cooperation, innovation, and a shared commitment to the sustainable management of this precious resource. The Ganga Water Treaty stands as a testament to the importance of international cooperation in managing shared natural resources, offering lessons for other nations facing similar challenges in the management of transboundary water resources. The river that flows through the hearts of millions of people must continue to be a symbol of collaboration and mutual benefit.

Vienna Convention
Introduction The Vienna Convention is a pivotal term in international law and diplomacy, often associated with various treaties concluded in Vienna, Austria. Among them, the most referenced is the Vienna Convention on Diplomatic Relations (1961). This treaty laid the groundwork for modern diplomatic relations and privileges, ensuring global peace, cooperation, and legal protections among states. What is the Vienna Convention? The term “Vienna Convention” broadly refers to a series of multilateral treaties negotiated in Vienna under the aegis of the United Nations or its affiliated bodies. These conventions aim to regulate diplomatic and consular relations, the law of treaties, and other aspects of international law. Historical Background Major Vienna Conventions Convention Year Subject Vienna Convention on Diplomatic Relations 1961 Codifies diplomatic immunity and privileges Vienna Convention on Consular Relations 1963 Outlines consular rights and duties Vienna Convention on the Law of Treaties 1969 Framework for drafting and enforcing treaties Vienna Convention for the Protection of the Ozone Layer 1985 Environmental protection treaty United Nations Convention Against Illicit Traffic in Narcotic Drugs and Psychotropic Substances 1988 Often referred to as the Vienna Convention on Narcotic Drugs Vienna Convention on Diplomatic Relations, 1961 Highlights: Key Provisions: Vienna Convention on Consular Relations, 1963 Key Points: Vienna Convention on the Law of Treaties, 1969 Major Articles: Objectives of the Vienna Conventions How the Vienna Convention Shapes Modern Diplomacy ? The Vienna Conventions are not just legal documents — they are the backbone of the international diplomatic system, enabling countries to maintain dialogue even during crises. Why It’s Relevant Today: Key Provisions (Across Major Conventions) Principle Description Inviolability Diplomatic missions and staff are protected from interference Immunity Legal protection against host country’s jurisdiction Host State Obligations Must ensure security and dignity of foreign diplomats Treaty Law Establishes procedures for treaty-making, enforcement, termination Notification & Consent No mission or consulate can be established without mutual consent Significance in International Relations Vienna Convention and India Vienna Convention and the Environment The term “Vienna Convention” is also used in environmental diplomacy. Vienna Convention for the Protection of the Ozone Layer (1985): India ratified it in 1991. Notable International Cases Case Summary Iran Hostage Crisis (1979) US embassy staff detained by Iran; violation of 1961 Convention Kulbhushan Jadhav Case (India vs Pakistan) Pakistan denied consular access; ICJ upheld Vienna Convention Devyani Khobragade Case (2013) Indian diplomat arrested in the US; triggered debate on immunity Challenges & Criticism Conclusion The Vienna Convention is a landmark achievement in international diplomacy and legal cooperation. It ensures mutual respect, sovereign integrity, and standardized protocols among nations. Despite certain limitations, its role in preserving global order and legal predictability is undeniable. As international relations evolve, so too must the mechanisms that safeguard them — and the Vienna Convention continues to be a cornerstone in that evolution. Quick Summary Table Convention Focus Area Year Vienna Convention on Diplomatic Relations Diplomatic immunity & relations 1961 Vienna Convention on Consular Relations Consular duties & immunities 1963 Vienna Convention on the Law of Treaties Treaty formation & interpretation 1969 Vienna Convention for Protection of Ozone Layer Environment 1985
Scheduled Commercial Banks (SCBs)
Introduction The Indian banking system plays a pivotal role in economic development and financial inclusion. Among its core components are the Scheduled Commercial Banks (SCBs), which form the backbone of formal credit delivery in the country. These banks operate under the regulatory framework of the Reserve Bank of India (RBI) and are listed in the Second Schedule of the RBI Act, 1934. What are Scheduled Commercial Banks? Definition: Scheduled Commercial Banks (SCBs) are banks that are: These banks can avail of facilities like refinance from the RBI, and are subject to CRR (Cash Reserve Ratio) and SLR (Statutory Liquidity Ratio) requirements. Classification of Scheduled Commercial Banks Scheduled Commercial Banks are broadly classified into the following: Type of SCB Description Public Sector Banks (PSBs) Majority owned by the Government of India Private Sector Banks Majority ownership lies with private entities or individuals Foreign Banks Incorporated outside India but operating through branches in India Regional Rural Banks (RRBs) Joint venture of Central Govt., State Govt., and Sponsor Banks for rural development Small Finance Banks (SFBs) Cater to underserved sections including small business units, micro & small industries Payments Banks Provide banking services such as deposits and remittances with certain restrictions Key Features of Scheduled Commercial Banks Public Sector Banks (PSBs) These are banks where the majority (≥51%) stake is held by the Government of India. Examples: Features: Private Sector Banks These are banks where the majority stake is held by private entities. Types: Characteristics: Foreign Banks These banks are headquartered outside India but operate branches or subsidiaries within India. Examples: Features: Regional Rural Banks (RRBs) RRBs are created to serve rural and semi-urban areas, with emphasis on agriculture and allied sectors. Key Points: Small Finance Banks (SFBs) These are niche banks designed to provide financial services to underserved and unbanked populations. Functions: Examples: Payments Banks These banks operate with certain restrictions but aim to enhance financial inclusion. Limitations: Examples: Role and Importance of Scheduled Commercial Banks Economic Development Employment Generation Financial Inclusion Monetary Policy Transmission Role in the Indian Economy Area Contribution Financial Inclusion Expanding banking access in rural and remote areas Credit Distribution Loans to agriculture, MSMEs, housing, and infrastructure Economic Growth Facilitating capital formation and entrepreneurship Government Schemes Implementation of PMJDY, MUDRA, KCC, etc. Monetary Policy Instruments of RBI monetary policy transmission Challenges Faced by Scheduled Commercial Banks Scheduled vs Non-Scheduled Banks Feature Scheduled Banks Non-Scheduled Banks Listed in RBI Schedule Yes No Borrowing from RBI Eligible Not eligible CRR/SLR Compliance Mandatory Not required Scope National/International Mostly local Stability Higher due to regulations Comparatively less Regulatory Framework Conclusion Scheduled Commercial Banks are the pillars of India’s financial system, facilitating credit flow, financial inclusion, and economic stability. With continuous reforms, digitization, and regulatory oversight, they are poised to play a greater role in India’s transformation into a $5 trillion economy. However, maintaining asset quality, improving governance, and ensuring customer satisfaction remain key priorities. FAQs on Scheduled Commercial Banks Q1. What is the difference between Scheduled and Non-Scheduled Banks?A: Scheduled banks are listed under the Second Schedule of the RBI Act, 1934 and are regulated by the RBI. Non-scheduled banks are not listed and do not have access to RBI refinancing. Q2. How many SCBs are there in India?A: As of 2025, there are 12 Public Sector Banks, 21 Private Sector Banks, 44 Foreign Banks, 43 Regional Rural Banks, 11 Small Finance Banks, and 4 Payments Banks. Q3. Can Scheduled Banks issue credit cards?A: All SCBs except Payments Banks can issue credit cards, subject to RBI guidelines.
Qualified Stock Brokers (QSBs)
Introduction In the evolving landscape of India’s securities market, ensuring investor protection and systemic stability is paramount. To address these concerns and enhance regulatory oversight, the Securities and Exchange Board of India (SEBI) introduced a new framework known as Qualified Stock Brokers (QSBs). This framework identifies and regulates certain stock brokers deemed systemically significant due to their scale, interconnectedness, or operational complexity. What are Qualified Stock Brokers (QSBs)? Qualified Stock Brokers are stockbrokers registered with SEBI who meet certain criteria indicating systemic importance in the securities market. These brokers handle large volumes of client transactions, hold significant investor funds or securities, or are operationally complex entities with widespread market reach. The QSB framework was introduced by SEBI in February 2023 to enhance surveillance, supervision, and risk management of such large intermediaries to preempt systemic risks. Background and Evolution The need for QSB regulation arose from high-profile incidents where broker failures (e.g., Karvy Stock Broking) resulted in investor losses and erosion of trust. SEBI recognized that certain brokers, due to their scale, client base, or market influence, posed risks akin to systemically important financial institutions in the banking sector. Taking inspiration from the global Financial Stability Board’s approach, SEBI began consultations in 2022 and formally launched the QSB framework in 2023. Objectives of the QSB Framework The QSB framework aims to: Regulatory Background The QSB framework is part of SEBI’s proactive regulatory approach inspired by global standards, such as: This initiative also complements SEBI’s existing risk-based supervision model for market intermediaries, where large and active brokers already undergo closer monitoring. Criteria for Identification of QSBs SEBI, in consultation with stock exchanges and clearing corporations, evaluates stock brokers based on several quantitative and qualitative parameters, such as: Based on a weighted scoring model, brokers crossing a pre-defined threshold are designated as QSBs. The list of QSBs is reviewed annually and published by SEBI and the stock exchanges. Enhanced Responsibilities and Obligations for QSBs Once designated as a Qualified Stock Broker, entities are subjected to a more stringent regulatory framework. Key obligations include: 1. Enhanced Risk Management Norms QSBs must maintain more robust risk management systems, including advanced algorithms for margin monitoring, exposure control, and order routing. 2. Higher Governance Standards They are required to adopt stronger corporate governance practices, including: 3. Stricter Cybersecurity and Technology Requirements QSBs must implement: 4. Periodic Stress Testing They must conduct and report results of stress testing of liquidity, trade volume, and operational capability. 5. Increased Reporting and Disclosure QSBs need to file more frequent compliance reports, technology risk audits, and capital adequacy certifications. Impact on the Securities Market The introduction of QSBs has had a multi-fold impact on India’s capital markets: Improved Investor Confidence Investors feel more secure dealing with brokers that meet elevated compliance and governance benchmarks. Enhanced Market Stability Risk mitigation at the intermediary level reduces the probability of large-scale disruptions. Better Service Standards Due to higher scrutiny, QSBs are incentivized to invest in client service infrastructure, cybersecurity, and seamless trading platforms. Competitive Benchmarking The framework pushes non-QSB brokers to enhance their practices to meet future thresholds and gain investor trust. Governance and Oversight Framework SEBI coordinates with the following entities to monitor QSBs: This multi-layered ecosystem ensures that no single agency bears the entire responsibility of oversight. Market Impact and Industry Response The introduction of the QSB classification has had significant ripple effects: Benefits of the QSB Framework The framework provides multiple direct and indirect benefits to the financial ecosystem: Challenges in Implementation Despite the benefits, the QSB framework faces several challenges: 1. Compliance Costs Meeting SEBI’s elevated standards involves heavy investment in technology, audits, and training. 2. Risk of Regulatory Arbitrage Smaller brokers might attempt to stay under the threshold to avoid QSB classification, creating fragmented regulatory oversight. 3. Client Over-Reliance on Big Brokers Retail clients might overly concentrate on QSBs, sidelining smaller, regional brokers, potentially reducing market diversity. 4. Operational Complexity Applying uniform criteria to brokers of different business models (e.g., discount vs. full-service) may sometimes create imbalances. Way Forward To address challenges and ensure smooth implementation, SEBI may consider: Conclusion The QSB framework marks a pivotal step in reinforcing the resilience of India’s capital market ecosystem. By identifying and regulating systemically significant brokers, SEBI is not only safeguarding investors but also laying the groundwork for a more transparent, accountable, and robust securities market. As more brokers inch closer to QSB criteria with growing investor participation and digitization, this framework will play an increasingly critical role in shaping the future of market infrastructure and intermediary governance in India.
Capital Expenditure
Introduction In any economy, investments in infrastructure, machinery, education, health, and defense are foundational to long-term growth. These investments are classified under Capital Expenditure (CapEx). Whether it is a country building highways or a company acquiring new equipment, capital expenditure reflects spending with future returns. What is Capital Expenditure? Capital Expenditure refers to spending on the creation, acquisition, or improvement of long-term assets such as buildings, infrastructure, machinery, and equipment. It is expenditure that adds value to existing assets or creates new assets, usually reflected in the balance sheet and not immediately charged as an expense in the income statement. Definition: Objectives of Capital Expenditure Components/Examples of Capital Expenditure Sector Example of Capital Expenditure Infrastructure Construction of highways, ports, and airports Power Installation of new power plants, solar farms Education Building new schools or upgrading institutions with smart classes Health Establishing new hospitals and medical colleges Defense Procurement of fighter jets, submarines, missile systems Railways Electrification of tracks, purchase of locomotives Agriculture Irrigation canals, cold storage facilities Capital vs Revenue Expenditure Basis Capital Expenditure Revenue Expenditure Nature Asset-creating and long-term Recurring and short-term Benefit Duration Long-term benefits Immediate or short-term Shown in Financials Appears in Balance Sheet Appears in Profit & Loss Account Examples Machinery, buildings, highways Salaries, pensions, subsidies Impact on Fiscal Deficit High impact, but productive in long run Higher levels may increase deficits quickly Capital Expenditure in Union Budget of India In the Union Budget 2024-25, India significantly increased its capital expenditure outlay: CapEx to GDP Ratio (India): Fiscal Year Capital Expenditure (% of GDP) 2020–21 1.6% 2021–22 2.3% 2022–23 2.7% 2023–24 3.0% 2024–25 (BE) 3.4% Importance of Capital Expenditure in Economic Growth Core Areas of Capital Expenditure Capital expenditure touches nearly every sector of the economy. Key areas include: These investments ensure that the country is not only catching up with current demands but also preparing for the future. Types of Capital Expenditure Challenges in Capital Expenditure Challenge Description Delay in Execution Project delays lead to cost overruns and low efficiency Underutilization of Funds States often fail to spend allocated funds timely Bureaucratic Bottlenecks Long approval processes delay implementation Land Acquisition Issues Infrastructure projects face delays due to land disputes Debt Burden High CapEx can strain fiscal deficit if not well planned Global Comparison Country CapEx Focus Key Investments China 6.5–8% of GDP in CapEx Railways, High-speed rail, urban infra USA 3.5–4% of GDP Military, innovation, highways India Rising to 3.4% of GDP (2024–25 BE) Railways, highways, urban infra Germany 2–2.5% of GDP Green energy, public transport Capital Expenditure and Fiscal Deficit Although capital expenditure increases the fiscal deficit in the short run, it is considered a productive deficit because: Global Perspective Globally, developed nations like the US, Germany, and China invest significantly in capital expenditure to maintain competitiveness, develop sustainable cities, and transition to green energy. India is now emulating this model, with emphasis on digital infrastructure, transportation, and green mobility. China, for example, has historically allocated over 6% of its GDP to capital expenditure, focusing on long-term industrial and urban transformation. India’s increasing CapEx allocation shows a shift toward the investment-led growth model seen in successful economies. Recent Reforms to Boost Capital Expenditure in India Conclusion Capital Expenditure is the engine of long-term economic growth, asset creation, and nation-building. While it may appear as a cost in the short term, it is an investment in the future. For a country like India striving for a $5 trillion economy, sustained and efficient capital expenditure is not a choice — it is a necessity.

Green India Mission (GIM)
Introduction India, with its diverse ecosystems and growing population, faces critical environmental challenges such as deforestation, land degradation, and climate change. In response to these threats, the Government of India under ministry of Ministry of Environment, Forest and Climate Change (MoEFCC) launched the Green India Mission (GIM) — a bold step toward ecological sustainability, forest-based livelihoods, and climate resilience. Formally launched in 2014 as part of the National Action Plan on Climate Change (NAPCC), the mission aims to enhance forest cover, restore degraded ecosystems, and improve ecosystem services while addressing the needs of forest-dependent communities. What is the Green India Mission (GIM)? The Green India Mission (GIM) is one of the eight core missions under the NAPCC. It seeks to: “Protect, restore, and enhance India’s forest cover and respond to climate change by enhancing ecosystem services and forest-based livelihoods.” Objectives of Green India Mission The Green India Mission (GIM) aims to enhance ecosystem services and forest-based livelihoods through afforestation and eco-restoration activities. Its key objectives include increasing forest and tree cover, improving the quality of existing forests, enhancing biodiversity, improving ecosystem services like water, soil, and climate regulation, and promoting climate adaptation by involving local communities in forest governance and management. Objective No. Target Area 1 Increase forest/tree cover on 5 million hectares of land 2 Improve quality of forest cover on another 5 million hectares 3 Enhance ecosystem services such as biodiversity and water 4 Increase forest-based livelihood opportunities 5 Strengthen community-based forest governance 6 Adapt forest ecosystems to climate change Key Features of the Green India Mission Feature Description Part of NAPCC One of the eight missions under the National Action Plan on Climate Change Target-Based Focus on quantifiable targets such as increasing forest/tree cover Participatory Approach Emphasizes Joint Forest Management Committees (JFMCs) and Gram Sabhas Multi-Ministerial Involvement Coordinated by MoEFCC with support from Rural Development and Tribal Affairs Period of Implementation 10 years (initially from 2014 to 2023, with extensions and scaling planned) Convergence Focus Converges with MGNREGA, CAMPA, PMKSY, etc. for resource efficiency Implementation Mechanism of Green India Mission Bottom-Up Planning Approach The Green India Mission follows a participatory planning process: Execution Bodies Target Areas and Afforestation Goals Activity Area (in million hectares) Afforestation on degraded forest land 1.5 Afforestation on non-forest degraded land 1.8 Agroforestry and social forestry 0.9 Forest improvement (existing low-density areas) 1.8 Urban and peri-urban greening 0.2 Institutional and community lands 0.8 Total Goal: 10 million hectares, with a special focus on tribal and forest-dependent communities. Funding Sources of GIM Source Description Government of India Budget Allocations through Ministry of Environment, Forest and Climate Change CAMPA Funds Compensatory Afforestation Management Planning Authority funds MGNREGA For soil conservation and water harvesting work International Funding UNDP, World Bank, GCF partnerships Convergence with other Schemes PMKSY, NRLM, National Bamboo Mission Institutional Framework Institution Role MoEFCC Nodal Ministry for policy and implementation State Forest Departments Execution of afforestation and restoration activities Gram Sabhas Approve micro-plans, monitor projects, and ensure participatory governance JFMCs (Joint Forest Management Committees) Execute village-level plans and involve local communities Notable Success Stories Maharashtra (Chandrapur District) Odisha (Kandhamal) Himachal Pradesh Achievements So Far (As per MoEFCC) Importance of GIM in Climate Change Mitigation The Green India Mission plays a key role in India’s international commitments: Paris Agreement Commitments (NDCs) SDG Alignment SDG Goal Contribution of GIM SDG 13 – Climate Action Enhances carbon sequestration SDG 15 – Life on Land Protects terrestrial ecosystems, forests, and biodiversity SDG 1 & 8 Promotes rural employment and livelihood opportunities Green India Mission vs CAMPA vs National Afforestation Programme Feature Green India Mission CAMPA NAP (Old Scheme) Focus Ecosystem restoration Compensatory Afforestation Afforestation on degraded land Community Involvement High Moderate Moderate Funded By MoEFCC, MGNREGA, CAMPA Diversion of forest land fees MoEFCC budget Scope Climate + Livelihood + Biodiversity Limited to forest loss compensation Forestry-based Recent Developments Challenges in Implementation Challenge Explanation Fund Delays Irregular and insufficient fund releases from central and state governments Capacity Constraints Lack of technical expertise at grassroots and panchayat levels Poor Community Participation Inadequate sensitization of local people in many areas Bureaucratic Delays Complex approval and monitoring procedures Overlap with other schemes Lack of coordination with CAMPA, MGNREGA, and other environmental missions Way Forward Frequently Asked Questions (FAQs) What is the main goal of Green India Mission? To increase and restore forest cover while ensuring ecosystem services and livelihood security. Is GIM a part of any international commitment? Yes, it supports India’s Nationally Determined Contributions under the Paris Agreement. What is the duration of the mission? Initially planned for 10 years from 2014; now being extended and integrated with newer climate policies. Who implements the GIM at the grassroots level? Gram Sabhas, JFMCs, and State Forest Departments implement the mission with community participation. Conclusion The Green India Mission is a visionary step by India towards combating climate change through forest-based solutions. Its strength lies in its holistic approach, blending climate resilience, ecosystem conservation, and community empowerment. However, realizing its full potential requires better funding, coordination, capacity-building, and technological adoption. In the age of environmental urgency, missions like GIM aren’t just programs—they are lifelines for our planet.

Index of Industrial Production
Introduction The Index of Industrial Production (IIP) is one of the most important economic indicators that reflect the growth pattern of various sectors in the Indian economy. Released monthly by the National Statistical Office (NSO) under the Ministry of Statistics and Programme Implementation (MoSPI), IIP helps in tracking the real-time movement in the volume of production across key industries. It serves as a crucial tool for policymakers, economists, researchers, and financial analysts to gauge industrial performance and guide investment and policy decisions. What is the Index of Industrial Production (IIP)? The IIP is a composite indicator that measures the short-term changes in the volume of production of a basket of industrial products during a given period with respect to a base year. Historical Background of IIP in India The concept of IIP was first introduced in India during the British era to monitor the performance of a few key industries. Since independence, India has regularly updated and expanded the scope of IIP to reflect structural changes in the economy. Period Key Development Pre-1950 Limited index focused on textile and steel industries 1950s–60s Focused on import-substituting industries 1970s–80s Shift toward capital goods and intermediate goods 1991 onward Post-liberalisation reforms led to rapid diversification 2011–12 Major overhaul of weights, items, and base year Objectives of IIP Components of IIP The IIP consists of three Broad Sectors and is further classified under Use-Based Classification. 1. Sectoral Classification Sector Weight in IIP (%) Manufacturing 77.63% Mining 14.37% Electricity 7.99% The manufacturing sector holds the highest weight, making it the most influential component of the IIP. 2. Use-Based Classification This classification reflects the purpose for which the goods are used: Use-Based Category Description Weight (%) Primary Goods Directly obtained from nature 34.05 Capital Goods Machinery and equipment for production 8.22 Intermediate Goods Used as inputs in further production 17.22 Infrastructure/Construction Goods Used in construction and infrastructure 12.34 Consumer Durables Long-lasting goods like appliances, vehicles 12.84 Consumer Non-Durables Goods consumed immediately like food, clothes 15.33 Base Year of IIP The base year revision is done periodically to reflect the structural changes in the economy and update the production basket. So far, the base year has changed as follows: Previous Base Year Revised Base Year Year of Change 1937 1946 1946 1946 1951 1951 1951 1956 1956 1956 1960 1962 1960 1970 1975 1970 1980–81 1986 1980–81 1993–94 1998 1993–94 2004–05 2011 2004–05 2011–12 2017 A further revision to the base year 2017-18 is under consideration to reflect current economic realities. Calculation Methodology Formula: IIP = (Production in current period / Production in base period) × 100 Importance of IIP Impact of IIP on Government and Economic Policy 1. Monetary Policy 2. Fiscal Policy 3. Sector-Specific Schemes IIP vs Global Industrial Indices Country Industrial Index Publisher Frequency Comparable to IIP? USA Industrial Production Index Federal Reserve Monthly Yes UK Index of Production Office for National Statistics Monthly Yes China Industrial Production Index National Bureau of Statistics Monthly Yes Germany Industrial Production Destatis Monthly Yes While methodologies differ, India’s IIP is globally comparable and adheres to UN standards for Industrial Statistics. Limitations of IIP Limitation Description Outdated product basket May not capture new and emerging industries. Monthly data volatility Subject to seasonal fluctuations and revisions. Limited service sector coverage Focused only on industrial output, ignoring the growing service sector. Delays in data reporting Often revised later due to incomplete or delayed data submission. Insufficient regional insights Does not provide state-wise or regional industrial data. Recent Trends in IIP (Example Data) Here’s a sample IIP growth trend for illustrative purposes (for 2024-25): Month IIP Growth (%) Major Highlights April 2024 4.2% Boost in electricity and mining output May 2024 5.5% Strong performance in capital goods June 2024 3.7% Decline in consumer durables July 2024 6.1% Growth in infrastructure and primary goods Note: Actual figures may vary. For updated data, visit mospi.gov.in. IIP vs Other Economic Indicators Indicator Measures Frequency Published By IIP Volume of industrial production Monthly MoSPI (NSO) GDP Overall economic output Quarterly CSO (MoSPI) PMI (Purchasing Managers Index) Business sentiments in manufacturing Monthly IHS Markit CPI (Consumer Price Index) Retail inflation Monthly NSO WPI (Wholesale Price Index) Wholesale inflation Monthly Office of Economic Adviser Future Outlook of IIP With the increasing focus on digital transformation, renewable energy, semiconductors, and green industrialization, the IIP is expected to undergo the following changes: Conclusion The Index of Industrial Production (IIP) is a critical indicator for assessing the health of the industrial sector in India. It plays a pivotal role in economic planning and decision-making. While it provides valuable insights, there is a growing need for methodological improvements, timely data updates, and inclusion of emerging sectors to ensure that IIP remains relevant in a dynamic economic environment. Frequently Asked Questions (FAQs) What does a positive IIP indicate? It indicates growth in industrial production compared to the base year. Why is the manufacturing sector given the highest weight in IIP? Because it constitutes the largest share of industrial output in the economy. How often is IIP released? Every month by the National Statistical Office (NSO). What is the current base year for IIP? 2011–12.
Advertising Standards Council of India (ASCI)
Introduction In an age dominated by digital and multimedia platforms, advertising has become an inseparable part of consumer engagement. However, the power of advertising must be tempered with responsibility and ethics. This is where the Advertising Standards Council of India (ASCI) steps in — a self-regulatory voluntary organization that ensures advertisements in India are honest, decent, and not misleading. What is the Advertising Standards Council of India (ASCI)? The Advertising Standards Council of India (ASCI) is a non-governmental, self-regulatory organization established in 1985. It seeks to maintain and enhance public confidence in advertising by ensuring that all advertisements conform to its Code for Self-Regulation in Advertising. ASCI is registered as a not-for-profit company under Section 25 of the Companies Act, 1956 (now Section 8 under the Companies Act, 2013). Key Facts at a Glance Feature Details Full Name Advertising Standards Council of India Established 1985 Type Voluntary Self-Regulatory Organization Legal Status Not-for-Profit under Companies Act Headquarters Mumbai, Maharashtra Area of Operation All forms of advertising in India Website www.ascionline.in Objectives of ASCI Structure of ASCI ASCI operates through various arms and committees that ensure objective decision-making and effective execution of its code. Board of Governors ASCI’s management is entrusted to a Board of Governors comprising members from: Consumer Complaints Council (CCC) The CCC is a critical pillar that evaluates complaints received. It consists of: The CCC reviews complaints and gives rulings based on ASCI’s code. ASCI Code of Self-Regulation in Advertising ASCI follows a Self-Regulatory Code, which lays down four key principles: 1. Honest and Truthful Ads must not mislead consumers through ambiguity, exaggeration, or deception. 2. Non-offensive to Public Decency Ads must not contain content that is indecent, vulgar, or repulsive. 3. Fair to Competition Advertisements should not unfairly discredit or attack competitors’ products. 4. Safe for the Public Ads must not promote practices or situations that could be harmful, especially to children. Scope of ASCI’s Jurisdiction ASCI monitors advertisements across the following media: ASCI Complaint Process: How it Works Step-by-Step Process: ASCI’s Monitoring and Digital Tools ASCI employs AI-based technology like ASCI’s NAMS (National Advertising Monitoring Service) to monitor thousands of ads every month across media platforms. Key initiatives: Key Achievements of ASCI Year Initiative / Milestone 2007 Recognized by the Ministry of Information & Broadcasting 2012 Partnered with the Department of Consumer Affairs 2017 Launched WhatsApp complaint facility 2021 Introduced guidelines for social media influencers 2022 Released detailed guidelines for crypto advertisements 2023 Strengthened AI-driven ad surveillance Legal Recognition of ASCI Although ASCI is a voluntary body, its decisions hold quasi-legal weight due to endorsements by: Common Violations Detected by ASCI Sector Nature of Violation Healthcare Misleading cure claims Education False promises of guaranteed success Food & Beverages Exaggerated health benefits Financial Products Inadequate disclosure of risks Real Estate Misleading pricing or project details Crypto/Virtual Assets Lack of disclaimers and risk disclosures Challenges Faced by ASCI Way Forward and Recommendations Conclusion The Advertising Standards Council of India (ASCI) plays a crucial role in maintaining ethical standards in India’s vibrant advertising ecosystem. By promoting self-regulation and responsible advertising, it protects consumer interests and enhances the credibility of the industry. However, with the ever-evolving nature of digital media, ASCI must constantly innovate and adapt its mechanisms to ensure ethical compliance across platforms.