All exams GA
In one line
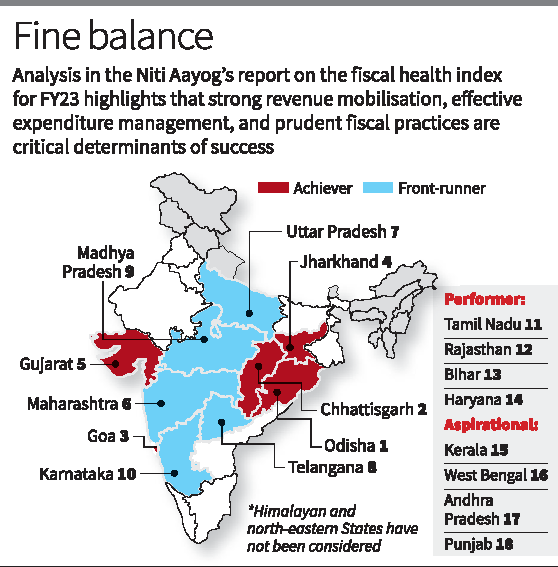
The Fiscal Health Index (FHI) evaluates the fiscal performance of 18 major Indian states.
It focuses on key indicators such as contribution to GDP, public expenditure, revenues and fiscal stability to assess statelevel fiscal health.
Purpose of the Report
Top Performing States Achievers
- States
- Odisha, Chhattisgarh, Goa and Jharkhand.
- Success Factors
- Strong capital investment up to 4% of Gross State Domestic Product or GSDP.
- Successful mobilization of non-tax revenue.
- Revenue surplus with low interest payment up to 7% of revenue receipts.
- Highest overall index score 678 for Odisha with a lead in debt index 990 and in debt sustainability at 640.
Front Runners
- States
- Maharashtra, Uttar Pradesh ,Telangana, Madhya Pradesh and Karnataka.
- Strengths
- Developmental expenditure very high up to 73 percent.
- Own tax revenues growth has been consistent.
- Improved fiscal management and the debt to GSDP ratio 24 per cent.
Moderate Performers
- States
- Tamil Nadu, Bihar, Rajasthan and Haryana.
- These States have performed moderately but have areas of improvement in the parameter of debt and also on expenditure management.
Aspirational States
- States
- Punjab, Andhra Pradesh, West Bengal and Kerala.
- Challenges
- Low revenue mobilization and the fiscal deficits are high.
- Increasing debt burdens and bad debt sustainability.
- Quality of Expenditure and Debt management
- Quality of expenditure and debt management is a concern for the States of Kerala and Punjab. West Bengal has problems with revenue mobilization and debt index issues.
- Andhra Pradesh is plagued with a very high fiscal deficit.
- The debt profile of Haryana is bad.
Fiscal Health Index (FHI) 2025 – Methodology & Key Indicators
Data Sources & Scope
- Source: Comptroller and Auditor General (CAG)
- Period Covered:
- 2022-23 (for index calculation and analysis)
- 2014-15 to 2021-22 (historical trends provided in the report appendix)
Five Major Sub-Indices & Their Minor Sub-Indices
| Major Sub-Index | Minor Sub-Indices | Purpose & Insights |
|---|---|---|
| 1. Quality of Expenditure | 1.1 Total Developmental Expenditure / Total Expenditure | Measures proportion of budget spent on long-term economic growth & social services |
| 1.2 Total Capital Outlay / GSDP | Assesses how much of the state’s economic output is invested in infrastructure & long-term assets | |
| 2. Revenue Mobilisation | 2.1 State Own Revenue / GSDP | Indicates financial independence by measuring state-generated revenue vs. economic output |
| 2.2 State Own Revenue / Total Expenditure | Shows the extent to which the state’s expenditures are funded by its own revenue sources | |
| 3. Fiscal Prudence | 3.1 Gross Fiscal Deficit / GSDP | Evaluates borrowing levels relative to economic size, signaling potential debt sustainability concerns |
| 3.2 Revenue Deficit / GSDP | Highlights if the state is generating sufficient revenue to cover its operational costs | |
| 4. Debt Index | 4.1 Interest Payments / Revenue Receipts | Measures percentage of revenue receipts used for interest payments, assessing debt servicing capability |
| 4.2 Outstanding Liabilities / GSDP | Reflects overall debt burden in proportion to the state’s economic output | |
| 5. Debt Sustainability | 5.1 Growth Rate of GSDP – Growth Rate of Interest Payments | A positive gap suggests debt is manageable; a negative gap indicates fiscal stress |
Detailed Explanation of Key Indicators
1. Quality of Expenditure
- Developmental Expenditure: Spending on long-term economic growth & infrastructure (schools, hospitals, roads, etc.)
- Non-Developmental Expenditure: Routine government expenses like salaries and operational costs
- Key Ratios:
- Developmental Expenditure/Total Expenditure → Shows government’s spending priorities
- Capital Outlay/GSDP → Measures investment in infrastructure & long-term assets
Free PDF · print or read offline
Download this page as a PDF
A clean PDF of this page with the C4S header — it opens right away, and the link comes to your WhatsApp too.
2. Revenue Mobilisation
- State Own Revenue: Income from state taxes & non-tax revenue sources
- Key Ratios:
- State Own Revenue/GSDP → Reflects state’s financial self-sufficiency
- State Own Revenue/Total Expenditure → Measures the extent to which a state funds its own expenses
3. Fiscal Prudence
- Gross Fiscal Deficit: Gap between total expenditure & total revenue, indicating borrowing needs
- Revenue Deficit: When government income is insufficient to cover operational costs
- Key Ratios:
- Gross Fiscal Deficit/GSDP → High ratio signals unsustainable borrowing
- Revenue Deficit/GSDP → High ratio shows reliance on borrowing to fund basic expenses
4. Debt Index
- Key Ratios:
- Interest Payments/Revenue Receipts → High ratio means more revenue is spent on debt servicing, reducing funds for development
- Outstanding Liabilities/GSDP → Measures overall debt burden relative to state’s economy
5. Debt Sustainability
- Key Indicator:
- Growth Rate of GSDP – Growth Rate of Interest Payments → Positive gap shows healthy economic management; negative gap signals financial distress
Key Takeaways
- Higher rankings in FHI indicate strong fiscal health, sustainable debt, and efficient resource allocation.
- Lower rankings highlight high deficits, excessive borrowing, and poor revenue generation.
- Interstate disparities in expenditure quality, debt management, and revenue mobilisation underline the need for targeted fiscal reforms.
Importance of the Report
- For better understandings of state level fiscal policy and practice.
- Proves necessity in revamping revenue mobilization and debt management issues in states.
- It encourages achievers and frontrunners to continue and build upon fiscal discipline and developmental spending.
This report provides a guide for states to enhance the stability of their finances and efficiently use their resources to achieve sustainable economic growth.
Source: The Hindu